Debug logs
Extended debug logs can be accessed by using your web browser to browse to https://<FortiAuthenticator IP Address>/debug.
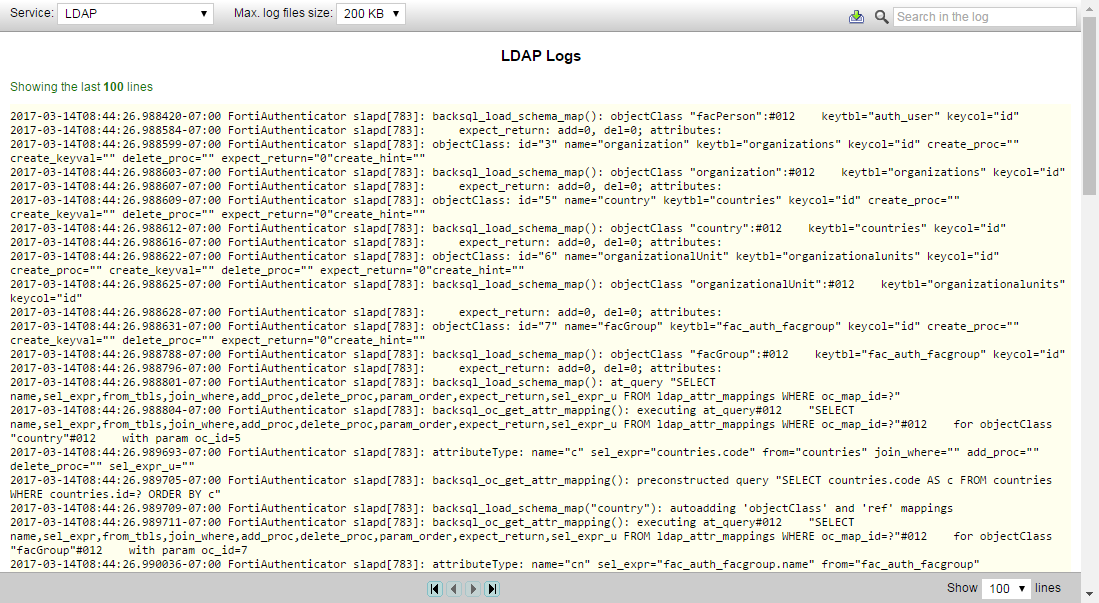
| Service |
Select the service whose logs are shown from the drop-down list:
Note: The CLI Packet Capture (tcpdumpfile) service is only available when the |
| Max. log files size |
To have access to a longer history of debug log files, a dropdown menu has been added for changing the maximum log file size, up to a maximum of 50 MB. Note that this is available for only certain debug log types. |
| Enter debug mode | If RADIUS Authentication is selected as the service, the option to enter the debug mode is available. See RADIUS debugging. |
| Search | Enter a search term in the search field, then select Search to search the debug logs. |
| Page navigation | Use the First Page, Previous Page, Next Page, and Last Page icons to navigated through the logs. |
| Show | Select the number of lines to show per page from the drop-down list. The options are: 100 (default), 250, and 500. |
RADIUS debugging
RADIUS authentication debugging mode can be accessed to debug RADIUS authentication issues.
In the debug logs screen, select RADIUS Authentication from the Service drop-down list, then select Enter debug mode from the toolbar.
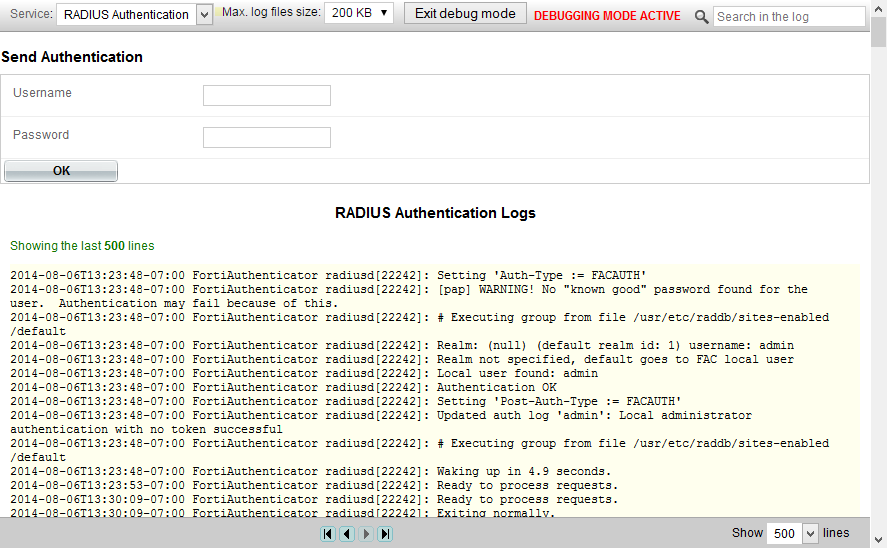
Enter the username and password then select OK to test the RADIUS authentication and view the authentication response and returned attributes.
Select Exit debug mode to deactivate the debugging mode.
TCP Stack Hardening
As of FortiAuthenticator 4.2, you can now configure the number of TCP SYNACK retries for the Linux kernel by accessing:
https://<FortiAuthenticator IP Address>/debug/tcp_tuning
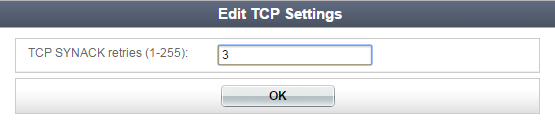
From here, enter the number of retries between 1 - 255 (default is 3).
Copyright © 2018 Fortinet, Inc. All Rights Reserved. | Terms of Service | Privacy Policy